Graphing Sine and Cosine Functions
When you graph onto a Cartesian plane, it refers to the "unrolling" of the unit circle.
When graphing, you plot the values of theta onto the x-axis and the trigonometric function values at theta onto the y-axis.
One cycle refers to the part of the graph from one point to another where the graph begins to repeat itself.
One period is how long one cycle is in either degrees or radians. The formula to determine the period of a sin x function or cos x function is 2π/|b| The formula to determine the period of a tan x function is π/|b|
Amplitude is the distance between the middle axis to the highest or lowest point of a sin x function or cos x function. When there is a change in amplitude it vertically stretches or compresses the original shape of the graph. The formula to determine the amplitude of a sin x function or a cos x function is |a|. Whereas the amplitude of a tan x function is infinite.
Note: amplitude = max - min / 2

Basic Equations:
y = asinbx
y = acosbx
y = atanbx
x represents theta values
y represents trigonometric function's value at theta
Remember to use quadrantal values for x when you are graphing a sin x function or a cos x function.
A tan x function will have asymptotes at quadrantal values where tan x is undefined.
For example:
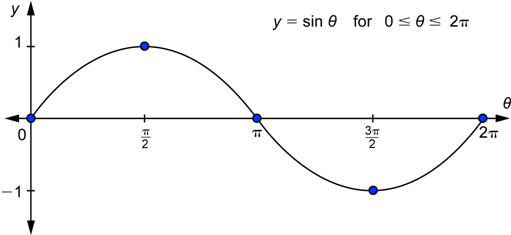
Note: When graphing sine functions, you always start at (0,0) to begin with.
y = sinx
Period (2π/|b|, b =1): 2π/|1| = 1
Amplitude (|a|): 1
Domain: {θ,θER}
Range: [-1, 1]
Maximum Value: @ y = 1
Minimum Value: @ y = - 1
y - intercept: @ y = 0
θ - intercepts: θ = πn, nEI
Note: When graphing cosine functions, you always start at (0, |a|) to begin with.
y = cosx
Period (2π/|b|, b =1): 2π/|1| = 1
Amplitude (|a|): 1
Domain: {θ,θER}
Range: [-1, 1]
Maximum Value: @ y = 1
Minimum Value: @ y = - 1
y - intercept: @ y = 1
θ - intercepts: θ = π/2 + πn, nEI
No comments:
Post a Comment